04 · Dusted · Tooling
Console Errors Bot
An automated monitor that sweeps 40+ client sites every 10 minutes for console and network errors and reports failures straight to Slack — cutting detection time by ~90%.
- Role
- Developer
- Client
- Dusted
- Timeframe
- 2024
~90%
faster issue detection
40+
client sites monitored
10 min
between sweeps
Overview
The story
Every ten minutes, a headless Chrome instance sweeps 40+ of Dusted's managed client sites, listening for the things users hit before anyone else notices: console errors, uncaught exceptions and failed network requests, each captured with its source location.
The hard part of monitoring real client sites isn't finding errors — it's not drowning in false ones. The bot carries a rules table of cookie-consent selectors covering a dozen consent frameworks, plus site-specific access flows that click through jurisdiction disclaimers on gated sites, all applied best-effort so a stale selector never turns into a phantom alert. Only genuine console errors page the team.
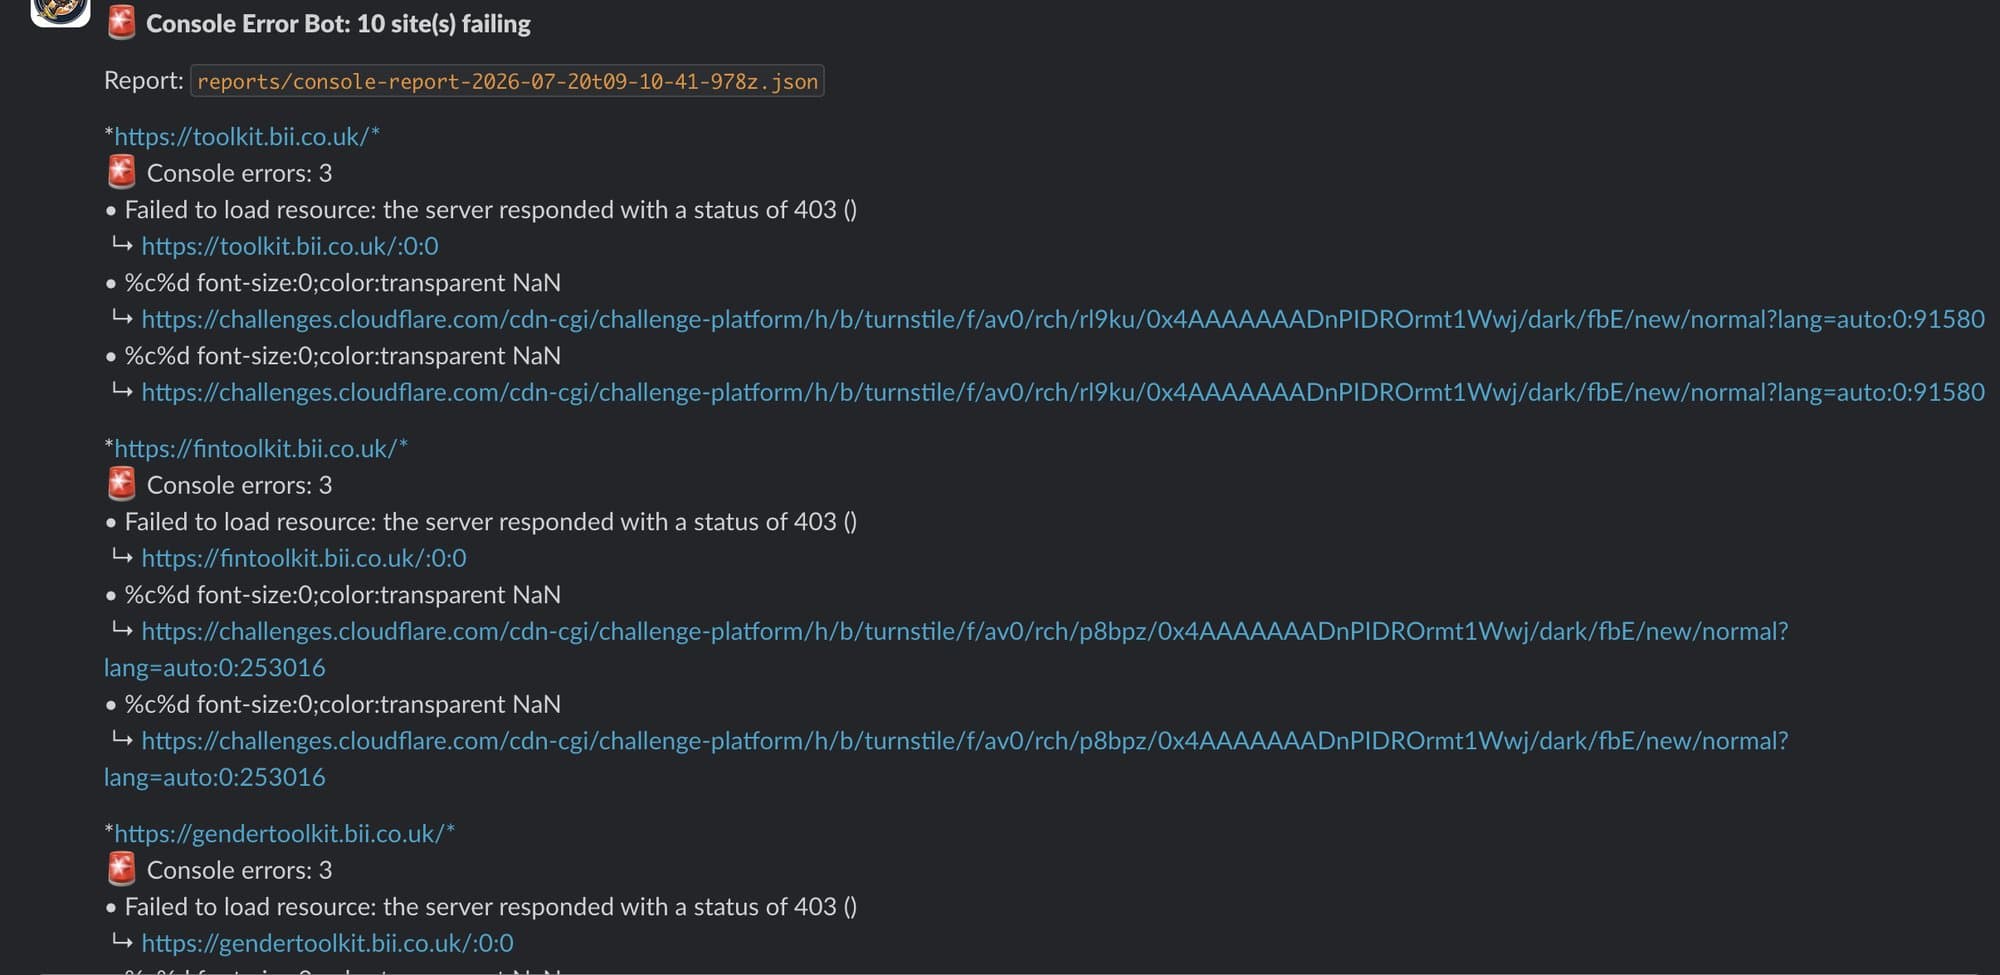
When something is really broken, a formatted Slack alert lands in the support channel naming each failing site with its top errors, and every run writes a timestamped JSON report for the archive. The whole thing is deliberately tiny — Puppeteer, native fetch and cron — with an end-to-end test path that injects a synthetic error to prove the alerting pipeline works.
Highlights
What makes it tick
- Headless-Chrome sweep of 40+ live client sites every 10 minutes
- Catches console errors, uncaught exceptions and failed network requests with source locations
- Cookie-consent auto-dismissal across a dozen consent frameworks to kill false positives
- Site-specific access flows for gated sites with jurisdiction disclaimers
- Slack Block Kit rollup alerts plus a timestamped JSON report of every run
- Deliberately tiny stack — Puppeteer, native fetch and cron — cheap to run, easy to trust
Stack
Built with
- Node.js
- Puppeteer
- Slack API
- cron
Gallery
In the wild